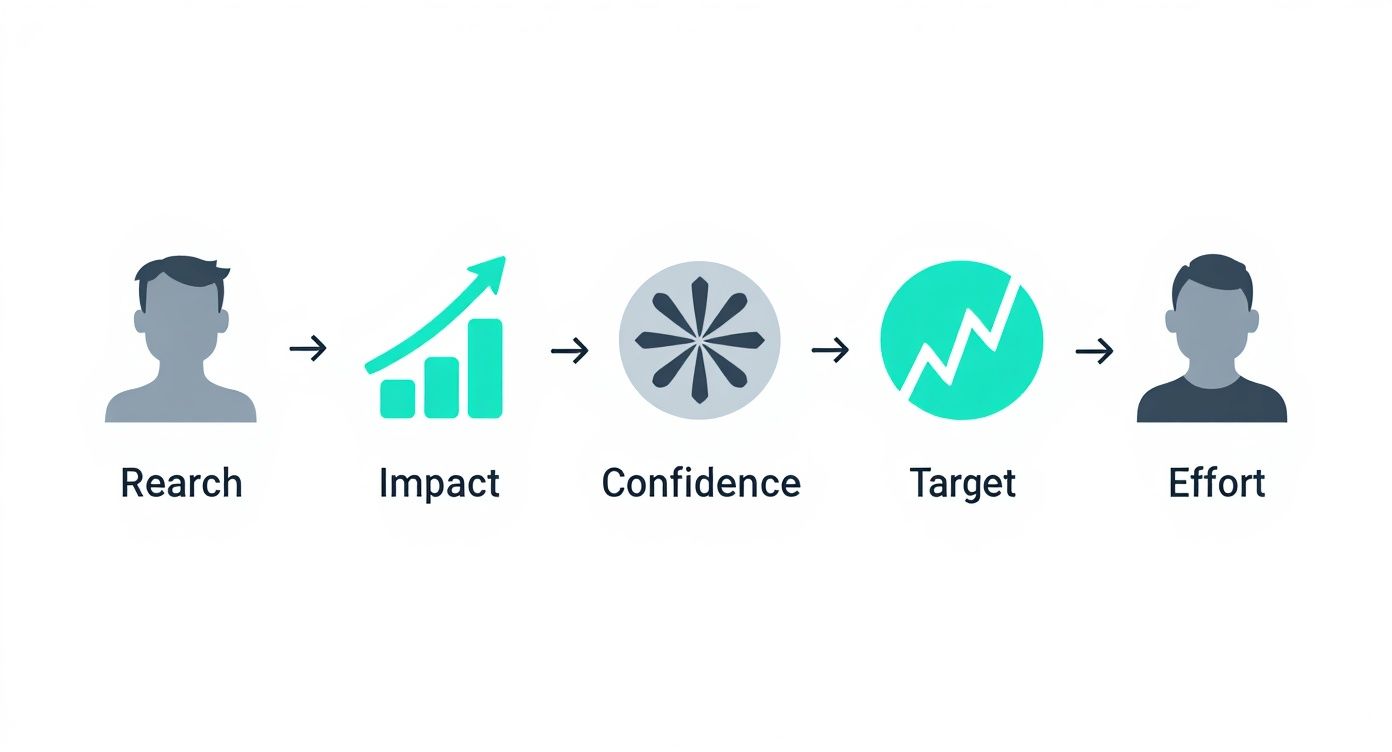
In a recent survey, over 50% of product managers cited “conflicting priorities” as their biggest challenge. If you’ve ever felt like your feature roadmap is decided by whoever talks the loudest, you’re not alone. The RICE prioritization framework is a simple, effective system designed to cut through the noise and end the circular debates. It gives you a clear, objective way to decide what to build next by scoring every idea against four key factors: Reach, Impact, Confidence, and Effort.
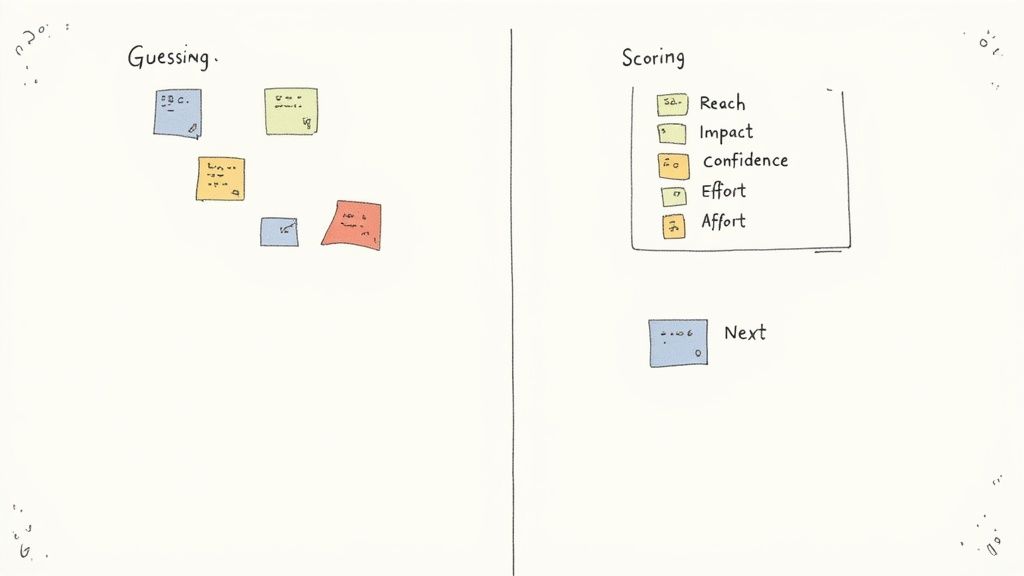
Stop Guessing and Start Scoring Your Product Roadmap
Chaotic roadmaps are expensive. In fact, research from the Standish Group shows that unclear objectives and poor communication are leading contributors to the nearly 70% of IT projects that fail to meet their goals. This is where a structured approach like the RICE model, originally developed by the product team at Intercom, really shines.
It helps you shift from subjective arguments to a transparent, data-informed process. It’s all about ensuring you build products that genuinely matter—both to your users and to the business. By forcing you to quantify each potential project, it grounds your strategy in reality. You’re not just picking features anymore; you’re making strategic investments with your team’s most valuable resource: their time.
Why a Framework Matters
Without a system, it’s easy for backlogs to get hijacked by common cognitive biases. We’ve all seen it happen—the “loudest voice in the room” or the “latest shiny object” can derail months of solid work. A formal framework like RICE adds a much-needed layer of objectivity. It standardizes the conversation, making sure every idea gets evaluated on the same playing field.
This structured approach brings a few major wins:
-
Better Alignment: A shared language for priorities can reduce miscommunication by over 50%, according to studies on team dynamics. It gets everyone on the same page, from stakeholders to engineers.
-
Improved Focus: When you have a clearly ranked list, your team can zero in on the tasks that deliver the most value instead of getting sucked into resource-draining “money pits.”
-
Data-Informed Decisions: RICE forces you to hunt for real data to estimate Reach and to honestly justify your Confidence score, moving decisions away from pure gut feeling.
To get a better handle on where RICE fits into the bigger picture, it helps to understand the core principles of product roadmap prioritization .
Beyond a Simple Score
While the final RICE score is a number, the real magic is in the conversations it creates. The discussions about why a feature has a massive impact or what data actually supports a high confidence score—that’s where the deep insights come from. This process turns prioritization from a top-down mandate into a collaborative, evidence-based exercise.
The goal of a prioritization framework isn’t just to get a ranked list. It’s to ensure the team is building a shared understanding of what success looks like and how each potential project contributes to that vision.
Ultimately, bringing the RICE framework into your workflow helps ensure every development cycle is spent on what truly counts. It’s a fantastic tool, but it’s even better when you pair it with other methods that measure user satisfaction. For example, you can balance RICE’s quantitative focus with the qualitative insights from the Kano Model to get a much richer, more complete picture of what your customers really need.
Putting a Number on It: How to Calculate Your RICE Score
Alright, let’s get down to the brass tacks. The whole point of the RICE framework is to take those endless debates about what to build next and turn them into a clear, numbers-driven decision. It all boils down to a simple formula.
The magic formula is: (Reach × Impact × Confidence) / Effort
What you’re left with is a single score that represents the “total impact per time worked.” For any engineering team trying to maximize ROI, this is the metric that matters. Let’s break down how to actually figure out the numbers for each part of that equation.
So, What’s the Reach?
Reach is all about figuring out how many people your project will actually touch in a given timeframe. The trick here is to be realistic and use actual data, not just pie-in-the-sky guesses. Pull up your analytics and ground your estimates in reality.
For a dev team, “Reach” could mean a few different things:
-
Users per month: How many of our active users will see this new dashboard widget?
-
Transactions per quarter: How many customers are going to go through this revamped checkout flow each quarter?
-
New sign-ups per month: How many fresh trial users will get to see this slick new onboarding flow?
Let’s say you’re building a new feature and you estimate it’ll be used by 1,500 unique people every month. Simple. Your Reach score is 1,500.
How Big is the Impact?
Impact is where you gauge how much a project will move the needle for each person it reaches. Will it boost conversion by 10%? Reduce churn by 5%? Since this can feel a bit subjective, the key is to agree on a consistent scale and stick to it for every project you evaluate.
Intercom , the folks who came up with RICE, suggest a straightforward scale:
-
3 = Massive impact
-
2 = High impact
-
1 = Medium impact
-
0.5 = Low impact
-
0.25 = Minimal impact
A feature that you expect will seriously drive up user adoption could get a 2. A minor UI tweak that just smooths out a rough edge? That’s probably more like a 0.5. This keeps everyone honest and prevents people from just saying every idea is “high impact.”
How Confident Are You, Really?
Confidence is your reality check. It’s a percentage that shows how much you’re banking on your estimates for Reach and Impact. Is your idea backed by solid user research and metrics, or is it more of a “gut feeling” you had in the shower? This number is crucial because it keeps overly optimistic ideas grounded.
A good way to think about it is on a tiered scale:
-
100%: High confidence. You have hard quantitative data and strong qualitative feedback to back it up.
-
80%: Medium confidence. You’ve got some data, but you’re also making a few logical leaps or assumptions.
-
50%: Low confidence. This is mostly a hunch. There’s little to no data to support the idea just yet.
An idea might sound amazing on paper, but if you have zero data to back it up, a low confidence score forces you to be honest with yourself. It’s often smarter to go with a well-understood project than a high-risk moonshot built on pure speculation.
Sizing Up the Effort
Last but not least, Effort. This is where you quantify the total time and resources your team will have to sink into the project to get it done. The most common way to measure this is in person-months—the amount of work one person can do in a month. It’s a clean way to tally up the time needed from everyone involved: product, design, and engineering.
To figure it out, just add up the time estimates from each discipline. For instance:
-
Product management: 1 week
-
Design: 2 weeks
-
Engineering: 5 weeks
That adds up to 8 weeks of total work, which is roughly 2 person-months. So, your Effort score is 2. Always use whole numbers and don’t be afraid to round up. It’s better to build in a little buffer for the inevitable surprises that pop up in 60-70% of software projects.
Putting RICE Into Practice with Real-World Scenarios
Alright, the formula is one thing, but the real “aha!” moment comes when you see the RICE prioritization framework in action. To really get a feel for it, let’s walk through two completely different projects an engineering team might tackle: a shiny new user-facing feature versus a critical (but invisible) backend refactor.
This is a great visual for how the pieces fit together to generate that final score.
What’s powerful here is how Effort acts as the great equalizer. A high effort estimate can tank an otherwise promising score, forcing honest conversations about value versus cost.
Scenario One: A New User-Facing Feature
Let’s say your team is thinking about adding social logins (like Google or GitHub) to your SaaS platform. The hypothesis is that this will reduce sign-up friction and boost trial conversions by 15%.
-
Reach: Looking at your analytics, you see 5,000 new users sign up for a trial every quarter. This feature would be in front of every single one of them. Reach = 5,000.
-
Impact: A smoother sign-up flow should have a direct effect on conversion rates. You believe this will be a high-impact change for that key metric. Impact = 2.
-
Confidence: This isn’t a wild guess. It’s a well-understood feature, you have quantitative data on sign-up friction, and 30% of support tickets are about login issues. You feel this is a very safe bet. Confidence = 100% (or 1.0).
-
Effort: You chat with the engineers. They figure it’s about two weeks for a front-end dev, one week for the backend, plus a few days for QA. All in, you’re looking at about one person-month of work. Effort = 1.
Now, let’s run the numbers: (5,000 × 2 × 1.0) / 1 = 10,000.
Scenario Two: A Backend Refactor
Next up, an internal project: refactoring the ancient billing service. No user will ever see this, but the tech lead insists it’s crucial for stability. It’s responsible for 40% of critical bugs and slows down new feature development by an estimated 25%.
-
Reach: It doesn’t touch customers directly, but it affects the 10 engineers who deal with this service each quarter. Reach = 10.
-
Impact: The goal is to slash bugs and accelerate development for new billing features. This is a massive internal impact on team efficiency and system stability. Impact = 3.
-
Confidence: The tech lead didn’t just bring a problem; they brought a plan. There’s a detailed technical doc, supported by data from your bug tracker. Confidence in the technical outcome is sky-high. Confidence = 100% (or 1.0).
-
Effort: This is a big one. The estimate is two senior engineers for a full month each. That’s two person-months. Effort = 2.
The RICE score here tells a very different story: (10 × 3 × 1.0) / 2 = 15.
This is where RICE really shines. It’s not just for flashy features. It creates a common language to compare totally different kinds of work—from user delights to gnarly technical debt—on a level playing field.
With a score of 10,000, the social login feature is clearly the higher priority right now compared to the refactor’s score of 15. This doesn’t mean the refactor is a bad idea. It just helps clarify where the team’s effort will deliver the most immediate value based on the current data.
If you’re looking to dig deeper into these kinds of frameworks, you’ll find more great insights on TaskIgnite’s blog for product prioritization insights . Adopting this structured thinking is also a huge part of building a mature development process. For teams wanting to ground their work in solid evidence, exploring practices like hypothesis-driven development can really complement the data-first approach that RICE champions.
Common Mistakes to Avoid When Using RICE
The RICE framework is a fantastic tool, but it’s not foolproof. I’ve seen teams get tripped up by a few common pitfalls that can easily lead to skewed priorities. Just plugging in numbers isn’t enough; you have to be mindful of how you’re using the framework to make sure it’s actually helping you build a roadmap that delivers real value.
One of the biggest traps teams fall into right away is inconsistent scoring. It happens all the time.
What you might call a “massive” impact (a 3), your colleague might see as just “high” (a 2). Suddenly, your objective, data-driven process devolves back into a debate based on gut feelings. This completely undermines the reason you started using RICE in the first place.
Establish a Clear Scoring Rubric
The best way to sidestep this problem is to create a crystal-clear scoring rubric that everyone on the team helps build and agrees to use. This isn’t just a suggestion; it’s essential.
Your rubric should spell out exactly what each score means for your specific team and product. Think of it as your team’s dictionary for RICE.
For example, you could define Impact scores with concrete examples tied to your own metrics:
-
Massive (3): A game-changer that directly moves a primary OKR, like increasing user retention by more than 5%.
-
High (2): A big win that significantly improves a key secondary metric, such as boosting feature adoption by 15%.
-
Medium (1): A solid quality-of-life improvement for a large chunk of your user base.
Your Confidence scores need the same treatment. A 100% score should be reserved for slam dunks—ideas backed by solid quantitative data (like A/B test results) and strong qualitative feedback (like a chorus of user interviews). On the flip side, a 50% score is for those back-of-the-napkin ideas that are mostly speculation for now.
This shared guide gets everyone on the same page and speaking the same language.
Ground Confidence in Data, Not Optimism
It’s easy to get excited about a new idea. But letting that enthusiasm inflate your Confidence score is a classic mistake. A project with a huge RICE score built on a shaky 50% confidence level is a risky bet. In fact, projects with poorly defined requirements and low data support are twice as likely to fail.
A low confidence score isn’t a red flag for a bad idea. It’s a signal to do more homework. It tells you to run a small experiment, send out a survey, or build a quick prototype to validate your assumptions before you sink a ton of resources into it.
This is a great spot to bring in tools that can add a dose of reality. For instance, a Context Engineer MCP can analyze your codebase to provide a more grounded Effort estimate. By identifying hidden dependencies or technical complexities early on, it can challenge an overly optimistic Confidence score, pulling the conversation away from pure enthusiasm and toward hard technical facts.
Balance RICE Scores with Strategic Goals
Finally, never forget that a high RICE score doesn’t automatically green-light a project. It’s entirely possible to have a feature with a sky-high score that does absolutely nothing to help you achieve your company’s most important goals for the quarter.
RICE is a tool for prioritization, not a substitute for strategic thinking.
Once you have your ranked list, always view it through the lens of your current business strategy. Ask yourself, “Does this top-scoring initiative actually help us hit our main quarterly objective?” If the answer is no, you should seriously consider prioritizing a lower-scoring item that does. This final check ensures your team’s hard work is always pushing the business forward.
Connecting Your Roadmap Priorities to Daily Development
Let’s be honest: a scoring framework is only useful if it actually influences the work getting done. Keeping your RICE scores in a spreadsheet often creates a chasm between the “why” of a project and the engineers who are heads-down building it. Research from Gallup shows that only about 15% of employees are actively engaged at work, and a lack of connection to the company’s mission is a major cause.
When that strategic context lives in one place and the actual coding happens somewhere else, you lose alignment. Fast. Motivation dips, and developers are left wondering if their work truly matters.
This is where the right tools can completely change the game. The goal is to weave that strategic thinking directly into the fabric of your team’s daily workflow.
From Spreadsheet to IDE
Imagine if developers could see the “why” behind their tasks right inside their Integrated Development Environment (IDE). Instead of just a vague ticket title, they see the business case, the expected reach, and the target impact. A simple task suddenly becomes a meaningful contribution to a bigger goal.
This is exactly the problem a Context Engineer MCP (Model Context Protocol) is built to solve. It connects the RICE score, business objectives, and even the core requirements directly to the code that brings them to life. This creates a powerful, continuous feedback loop.
When an engineer understands not just what they are building but why it scored so high, they make smarter micro-decisions. They can align their technical choices with the business intent, which almost always leads to a better product.
This approach transforms the RICE prioritization framework from a distant planning exercise into a living, breathing part of the development cycle. Engineers see the tangible results of their efforts, keeping everyone motivated and pointed in the same direction.
Of course, this all hinges on having clear and well-structured planning documents from the very beginning. To nail this crucial first step, take a look at our guide on how to write product requirements that can feed this kind of integrated workflow.
Ultimately, bridging the gap between priorities and daily development ensures that the big strategic decisions you make in a planning session are faithfully executed in the code.
Got Questions About RICE? We’ve Got Answers.
Even a straightforward formula like RICE can spark a few questions once you start applying it. Let’s tackle some of the most common ones that pop up when teams first begin using this model.
Can You Use RICE for Bugs and Tech Debt?
Absolutely. You just need to get a little creative with how you define each factor. It’s not just for shiny new features.
-
For Bugs: Think of Reach as the number of users hitting the bug or maybe the monthly volume of support tickets it creates. Impact then becomes about severity. A critical bug that corrupts data? That’s an easy 3. A minor visual glitch that’s just annoying? Probably a 0.5.
-
For Tech Debt: When you’re looking at that messy code you’ve been meaning to refactor, Reach could be the number of developers whose work is constantly slowed down by it. The Impact could be measured in terms of risk—like the potential for outages, security holes, or, on the flip side, the massive speed boost your team would get after a clean-up.
So, What’s a “Good” RICE Score?
This is a trick question. There’s no such thing as a universally “good” RICE score. The numbers are only meaningful when compared to each other, right inside your own backlog.
A project that scores 120 isn’t objectively “good” on its own; it’s simply a higher priority than the one that scored 60 on your list. The magic isn’t in the number itself, but in the prioritized ranking that shakes out when you score a bunch of initiatives together. It’s a comparison tool, not a report card.
The real power of the RICE framework comes from scoring a whole batch of potential projects at once. This forces a clear, rank-ordered list to the surface, showing you what’s most important for your team to tackle right now.
How Often Should We Re-Score Everything?
Your priorities aren’t carved in stone, so your scores shouldn’t be either. A good rule of thumb is to revisit and re-evaluate your backlog at least once a quarter. Markets change, and what was a top priority three months ago might be irrelevant today.
You’ll also want to do a spot-check anytime you have a major shake-up, like:
-
A shift in company strategy that changes what’s important.
-
A wave of new user feedback that changes your assumptions about Reach or Impact.
-
A big move from a competitor that makes one of your planned features suddenly more urgent.
New information can change your Reach, Impact, and especially your Confidence estimates overnight. Regular check-ins make sure your roadmap reflects reality and your team stays focused on what truly matters.
Embedding this kind of strategic thinking directly into your team’s daily work is a game-changer. Context Engineering bridges the gap between a high-level RICE score and the developers actually building the feature, pulling project goals and business context right into the IDE. You can see how it works at https://contextengineering.ai .